In this second part of the series looking at common non-precipitation radar echoes, we will look at several examples of biological scatter, including birds, bats, and insects. Dual-polarization data is usually the best way to distinguish biological echoes from precipitation, especially in a static image. These types of echoes generally have low a correlation coefficient and high differential reflectivity. The following can help identify what kind of creatures are responsible for specific common patterns of biological echoes in radar data at certain times of the day or year.
Part 2 – Biological Scatter
1. Birds in the Morning
Certain types of birds (purple martins are one of the most common) spend the night roosting in large flocks, and then they all take off in the morning to search for food. This motion frequently shows up as an expanding ring of reflectivity for a few scans around sunrise. Common dual-polarization signatures of birds are high differential reflectivity and low correlation coefficient.
Reflectivity loop from KFFC on July 12, 2017, showing several flocks of birds taking off near sunrise (circled areas).
2. Bats in the Evening
Bats also sleep in large numbers in a single spot, usually in a cave, then take off all at once to find food. However, because bats are nocturnal, they take off around sunset. The radar signature of bats and birds taking off in large numbers from a roosting area are very similar (expanding ring of reflectivity, high differential reflectivity, low correlation coefficient) to each other. The best way to tell if it is birds or bats is the time of day (birds will be seen near sunrise and bats near sunset).
Reflectivity loop from KDFX on April 9, 2018, showing multiple bat colonies leaving their roosts near sunset.
3. “Bloom”
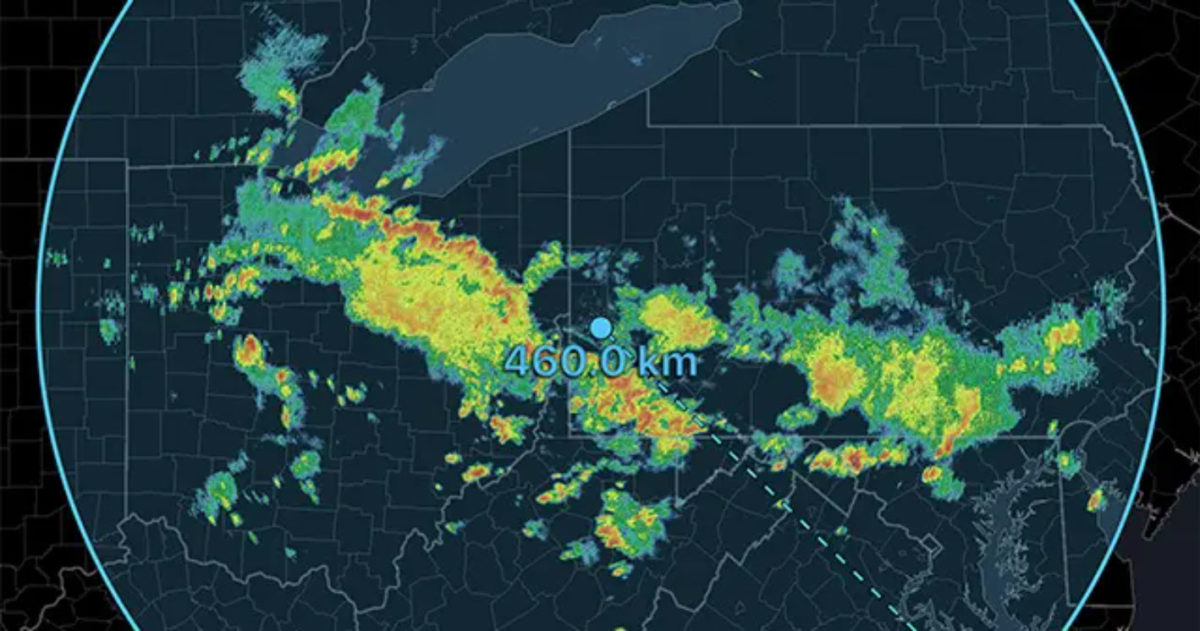
Ever notice that green blob that pops up around virtually every radar in the spring and summer about the time the sun goes down? This imagery is commonly referred to as “bloom” and is mostly due to radar return from all the insects that are flying around in the evening. Bloom may also be enhanced by migratory birds in the spring and fall, as several migratory species fly at night. The increase in size covered by these echoes from daytime to nighttime is mostly related to changes in the vertical temperature and moisture profile that cause the radar beam to stay closer to the ground at night (more about this in part 3 of this series).
Reflectivity loop from KTLX on May 5, 2018, showing a rapid increase of reflectivity after sunset commonly referred to as “bloom.”
This likely contains both insects and migrating birds.
4. Migratory Birds
Did you know that some researchers use radar to study the migration patterns of some bird species? It’s true, here are some links:
Radar Aeroecology
Understanding Radar and Birds
In general, the pattern is similar to the “bloom” pattern above, in that reflectivity ramps up shortly after sunset in a large circle or ring surrounding the radar. One key thing that can distinguish migrating birds from insects is that the radar velocity may be different from the prevailing wind. In the below example from Topeka, KS, the prevailing winds are from the west or northwest, consistent with the direction the rain showers are moving. However, most of the remaining return is from birds flying north, so the velocity data indicates motion toward the north, except for the showers and outflow boundaries to the north that are moving southeast, consistent with prevailing mid-level winds. The dual-pol variables, in this case, show a unique directional signature. Differential reflectivity is high to the east and west, but lower to the north and south. The data look this way because birds look different to the radar when viewed head-on (toward the north or south) or from the side (toward the east or west), and all the birds are oriented the same way. The correlation coefficient is also noticeably lower when viewing the birds from behind versus from the front, but all the biological scatter is much lower than the precipitation to the north (correlation coefficient near 1).
Reflectivity and velocity loop from KTWX showing some showers and outflow boundaries to the north of the radar,
followed by the onset of nocturnal bird migration.
As in above loop, but dual-pol variables differential reflectivity and correlation coefficient.
5. Extreme Biological Scatter
Though most cases of biological scatter produce low reflectivity values (<20 dBZ), some cases can be more significant. One typical situation is the mayfly hatch when incredible numbers of mayflies emerge from waterways across the Midwest during the early summer. The mayflies show up as areas of enhanced reflectivity along rivers or over lakes in the evening. Another example was a swarm of grasshoppers in Oklahoma and Texas in July 2015.
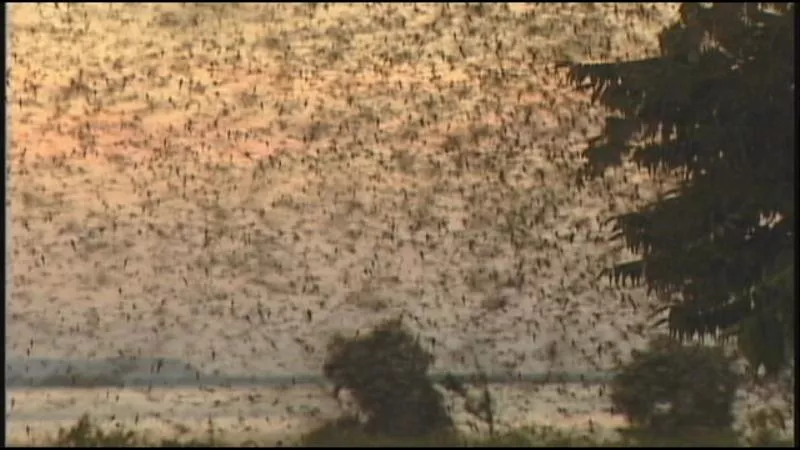
Photo of mayflies during a hatch.
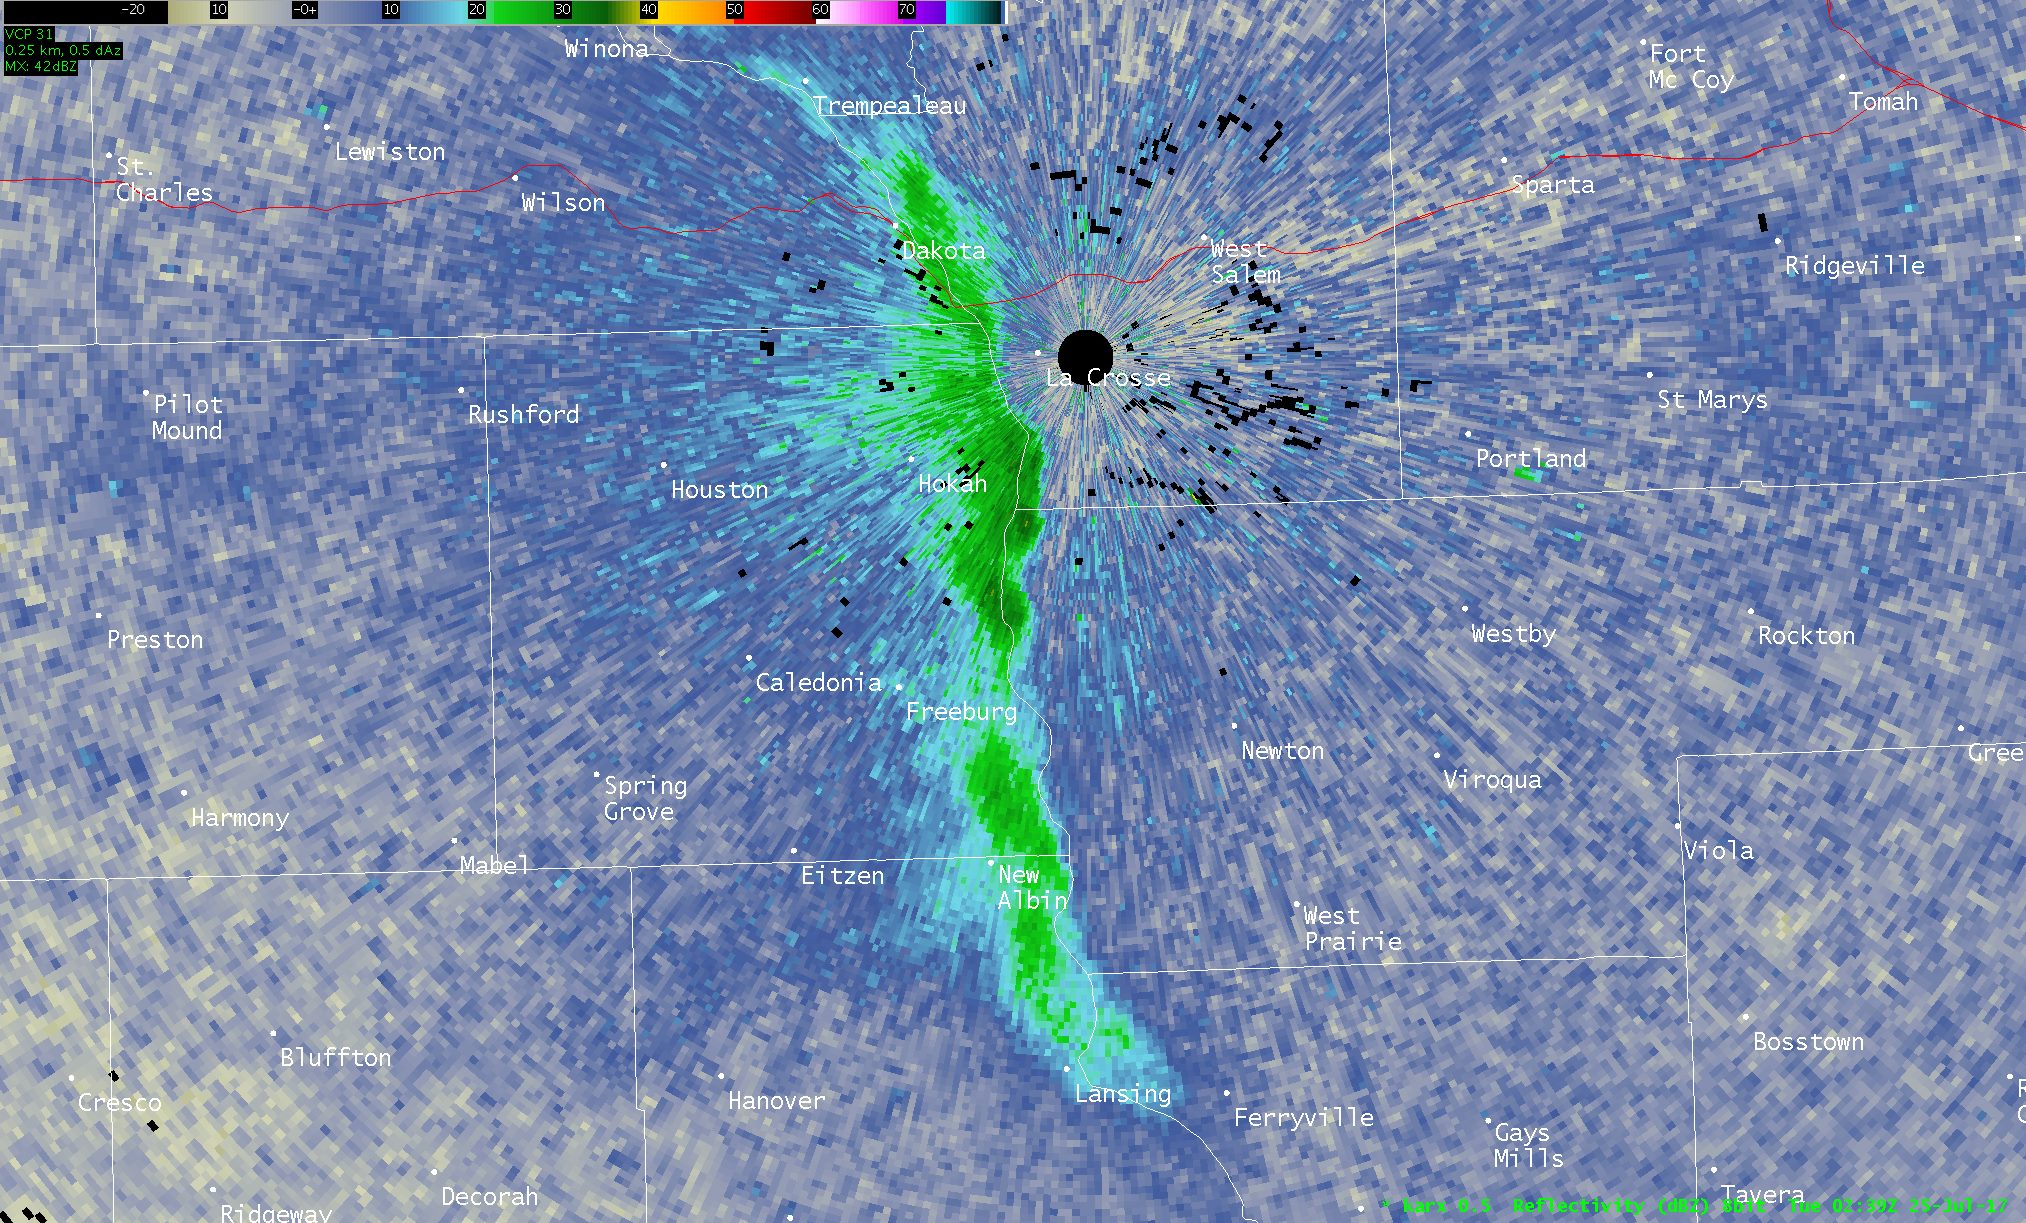
Radar image of mayfly hatch along the Mississippi River near KARX. Image courtesy of NWS La Crosse, WI FB page.
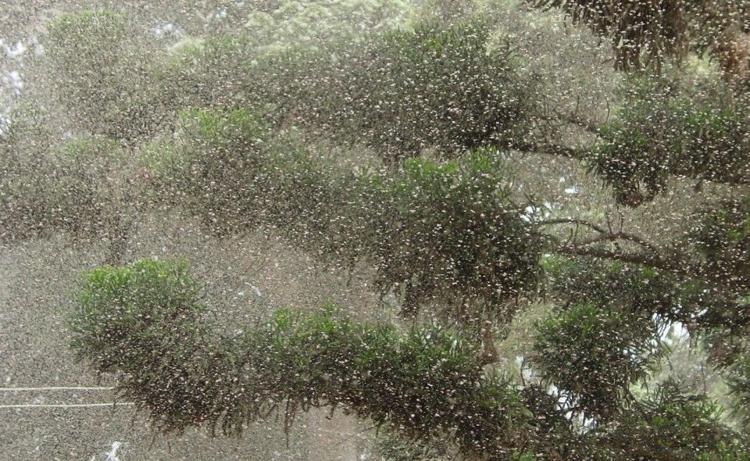
Photo of grasshopper swarm.
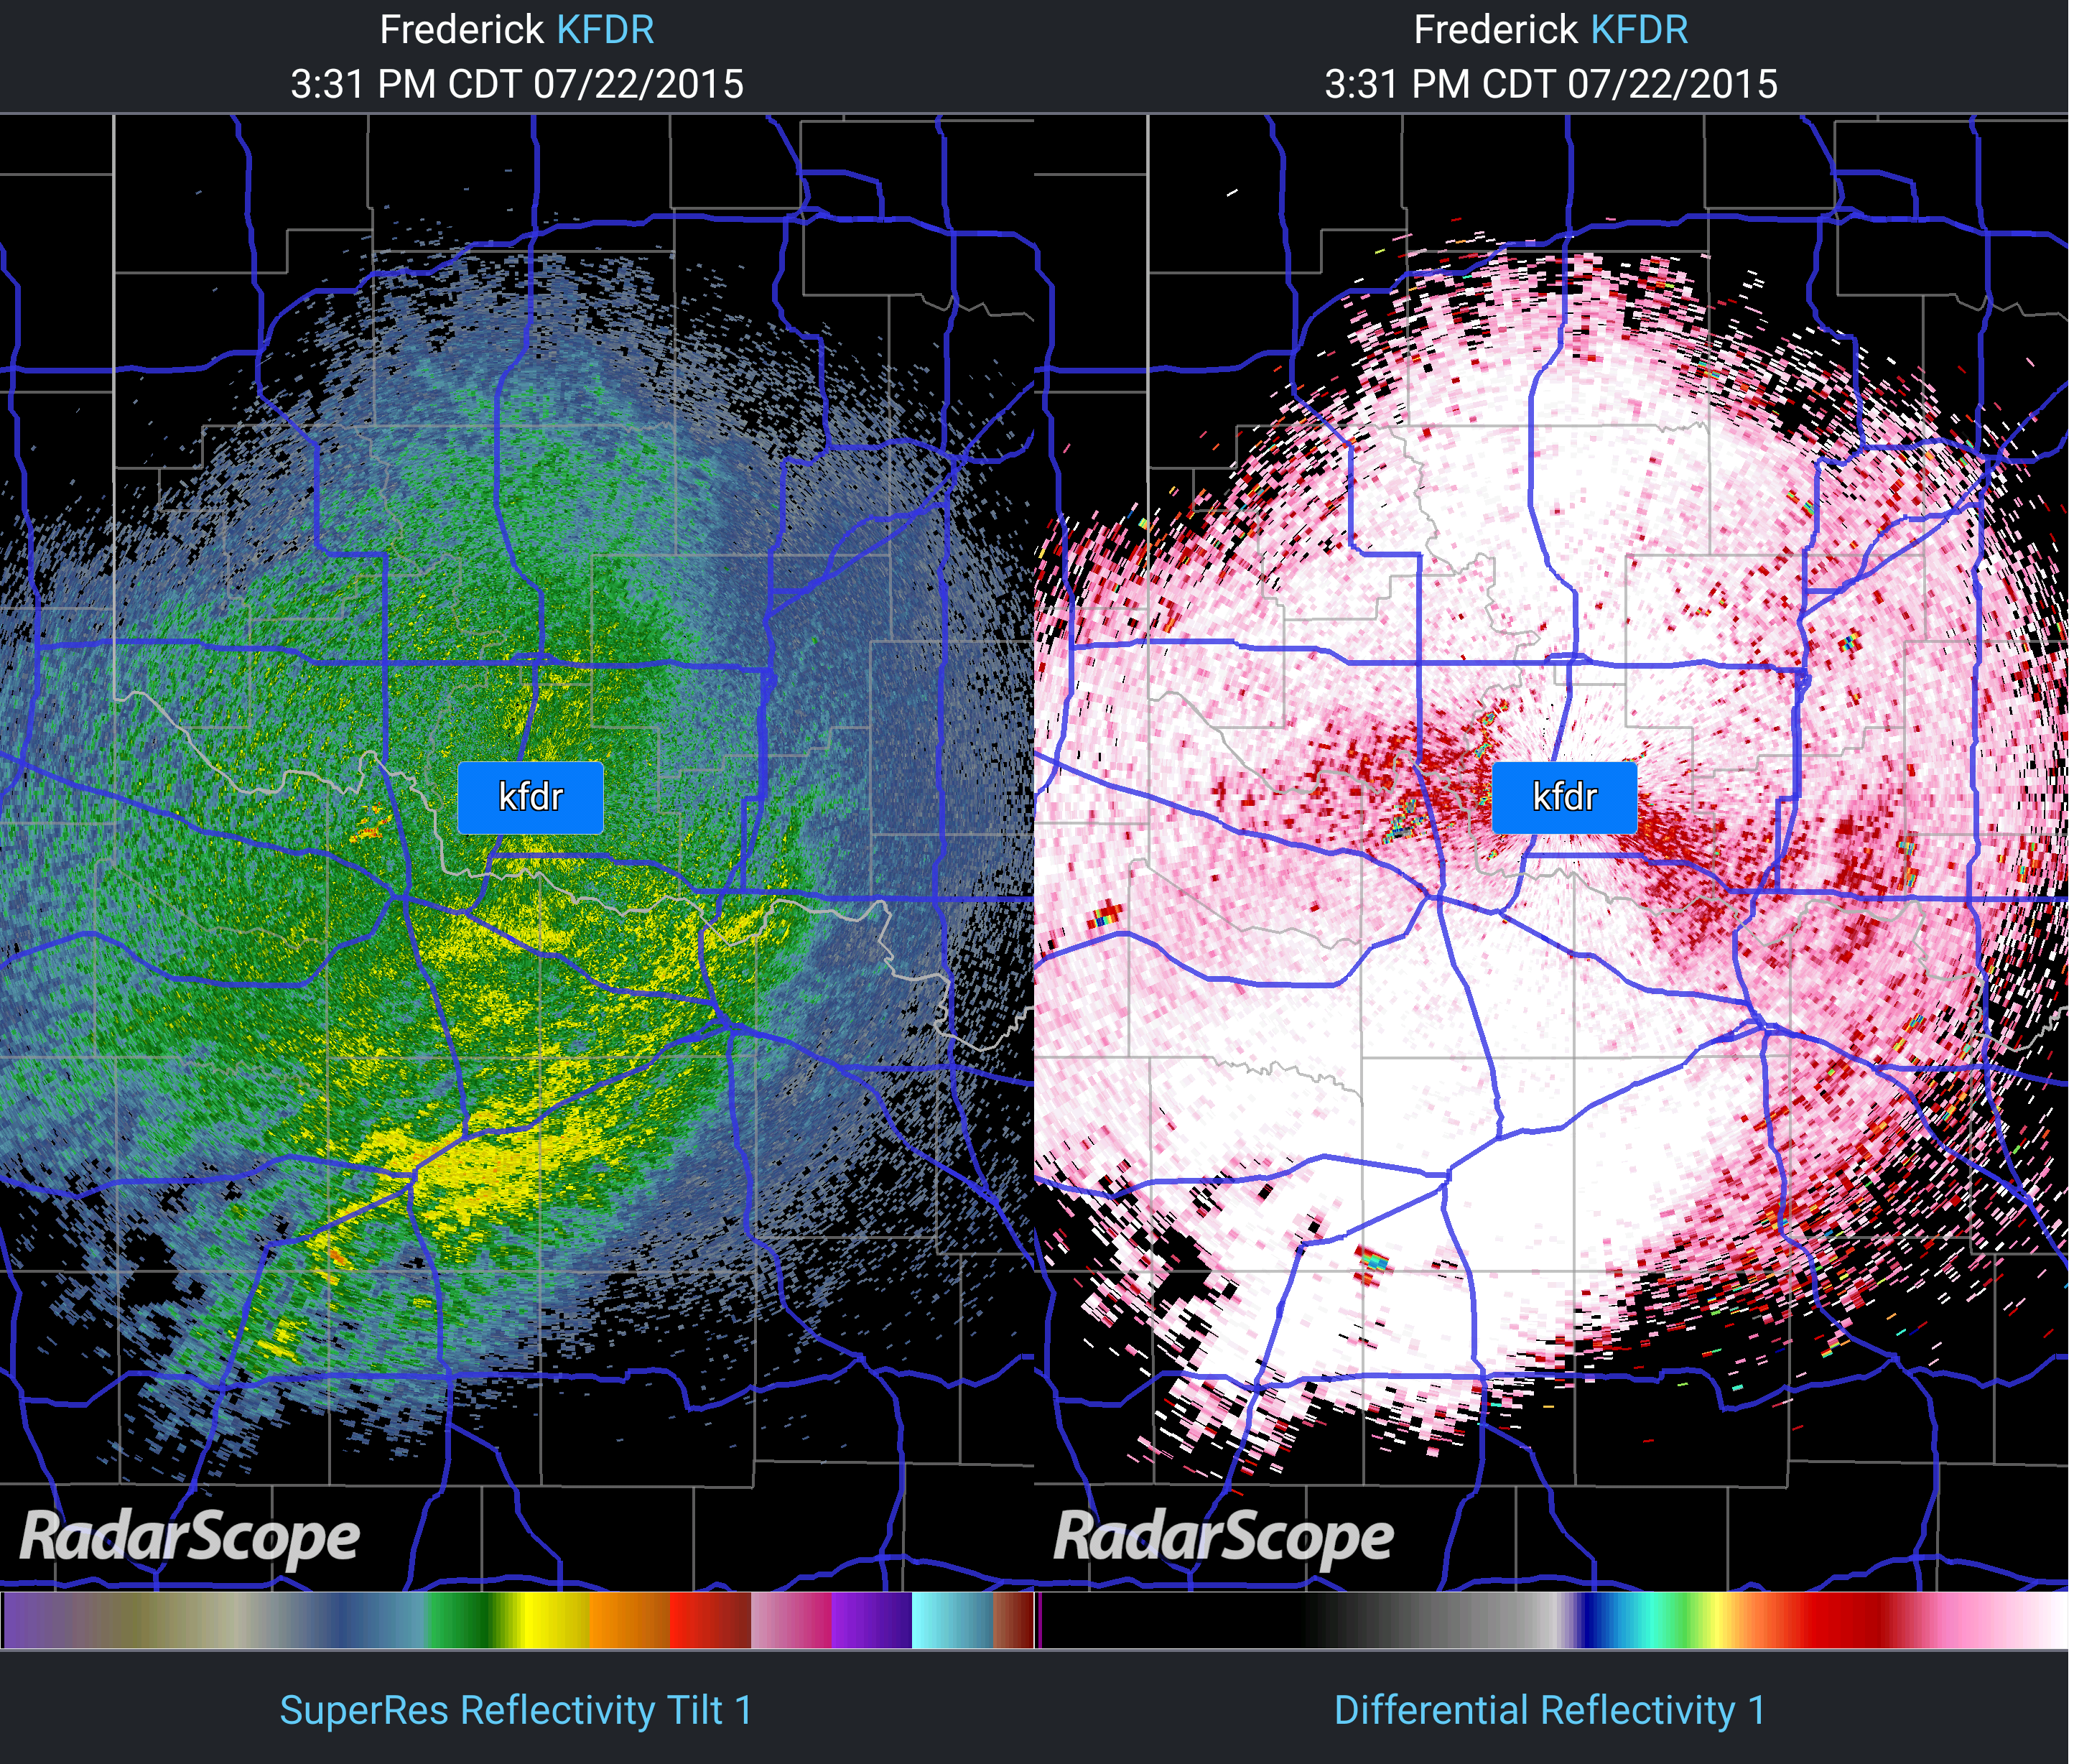
Radar reflectivity and differential reflectivity from KFDR showing swarm of grasshoppers.
Yellow areas in reflectivity are over 30 dBZ.
Conclusion:
Last time, we viewed atmospheric boundaries and circulations. In this installment, we saw several examples of common patterns of biological activity that can be observed with radar. Some happen on a daily scale, such as birds or bats waking up and dispersing to search for food, and some occur on a seasonal scale, such as bird migration. Next time, we will look at other assorted signatures, such as smoke, wind farms, and other ground clutter.