The release of RadarScope 3.8 has added features that can not only prepare you for the potential for severe weather but can provide more information about storms once they develop. Some of these features include the Day 1 Convective Outlooks and Local Storm Reports, which are available with a RadarScope Pro Tier 2 subscription. Both of these features can be accessed in the Settings menu under Layers.
Day One Convective Outlooks are issued four times a day from NOAA’s Storm Prediction Center in Norman, Oklahoma. These outlooks highlight areas of potential severe thunderstorm development for the current day across the continental United States. The areas where severe thunderstorms are forecast are outlined. The color of the contour denotes the risk (brown for marginal, green for slight, yellow for enhanced, red for moderate, and pink for high). Here is an example of what the Day One Convective Outlook might look like in RadarScope.
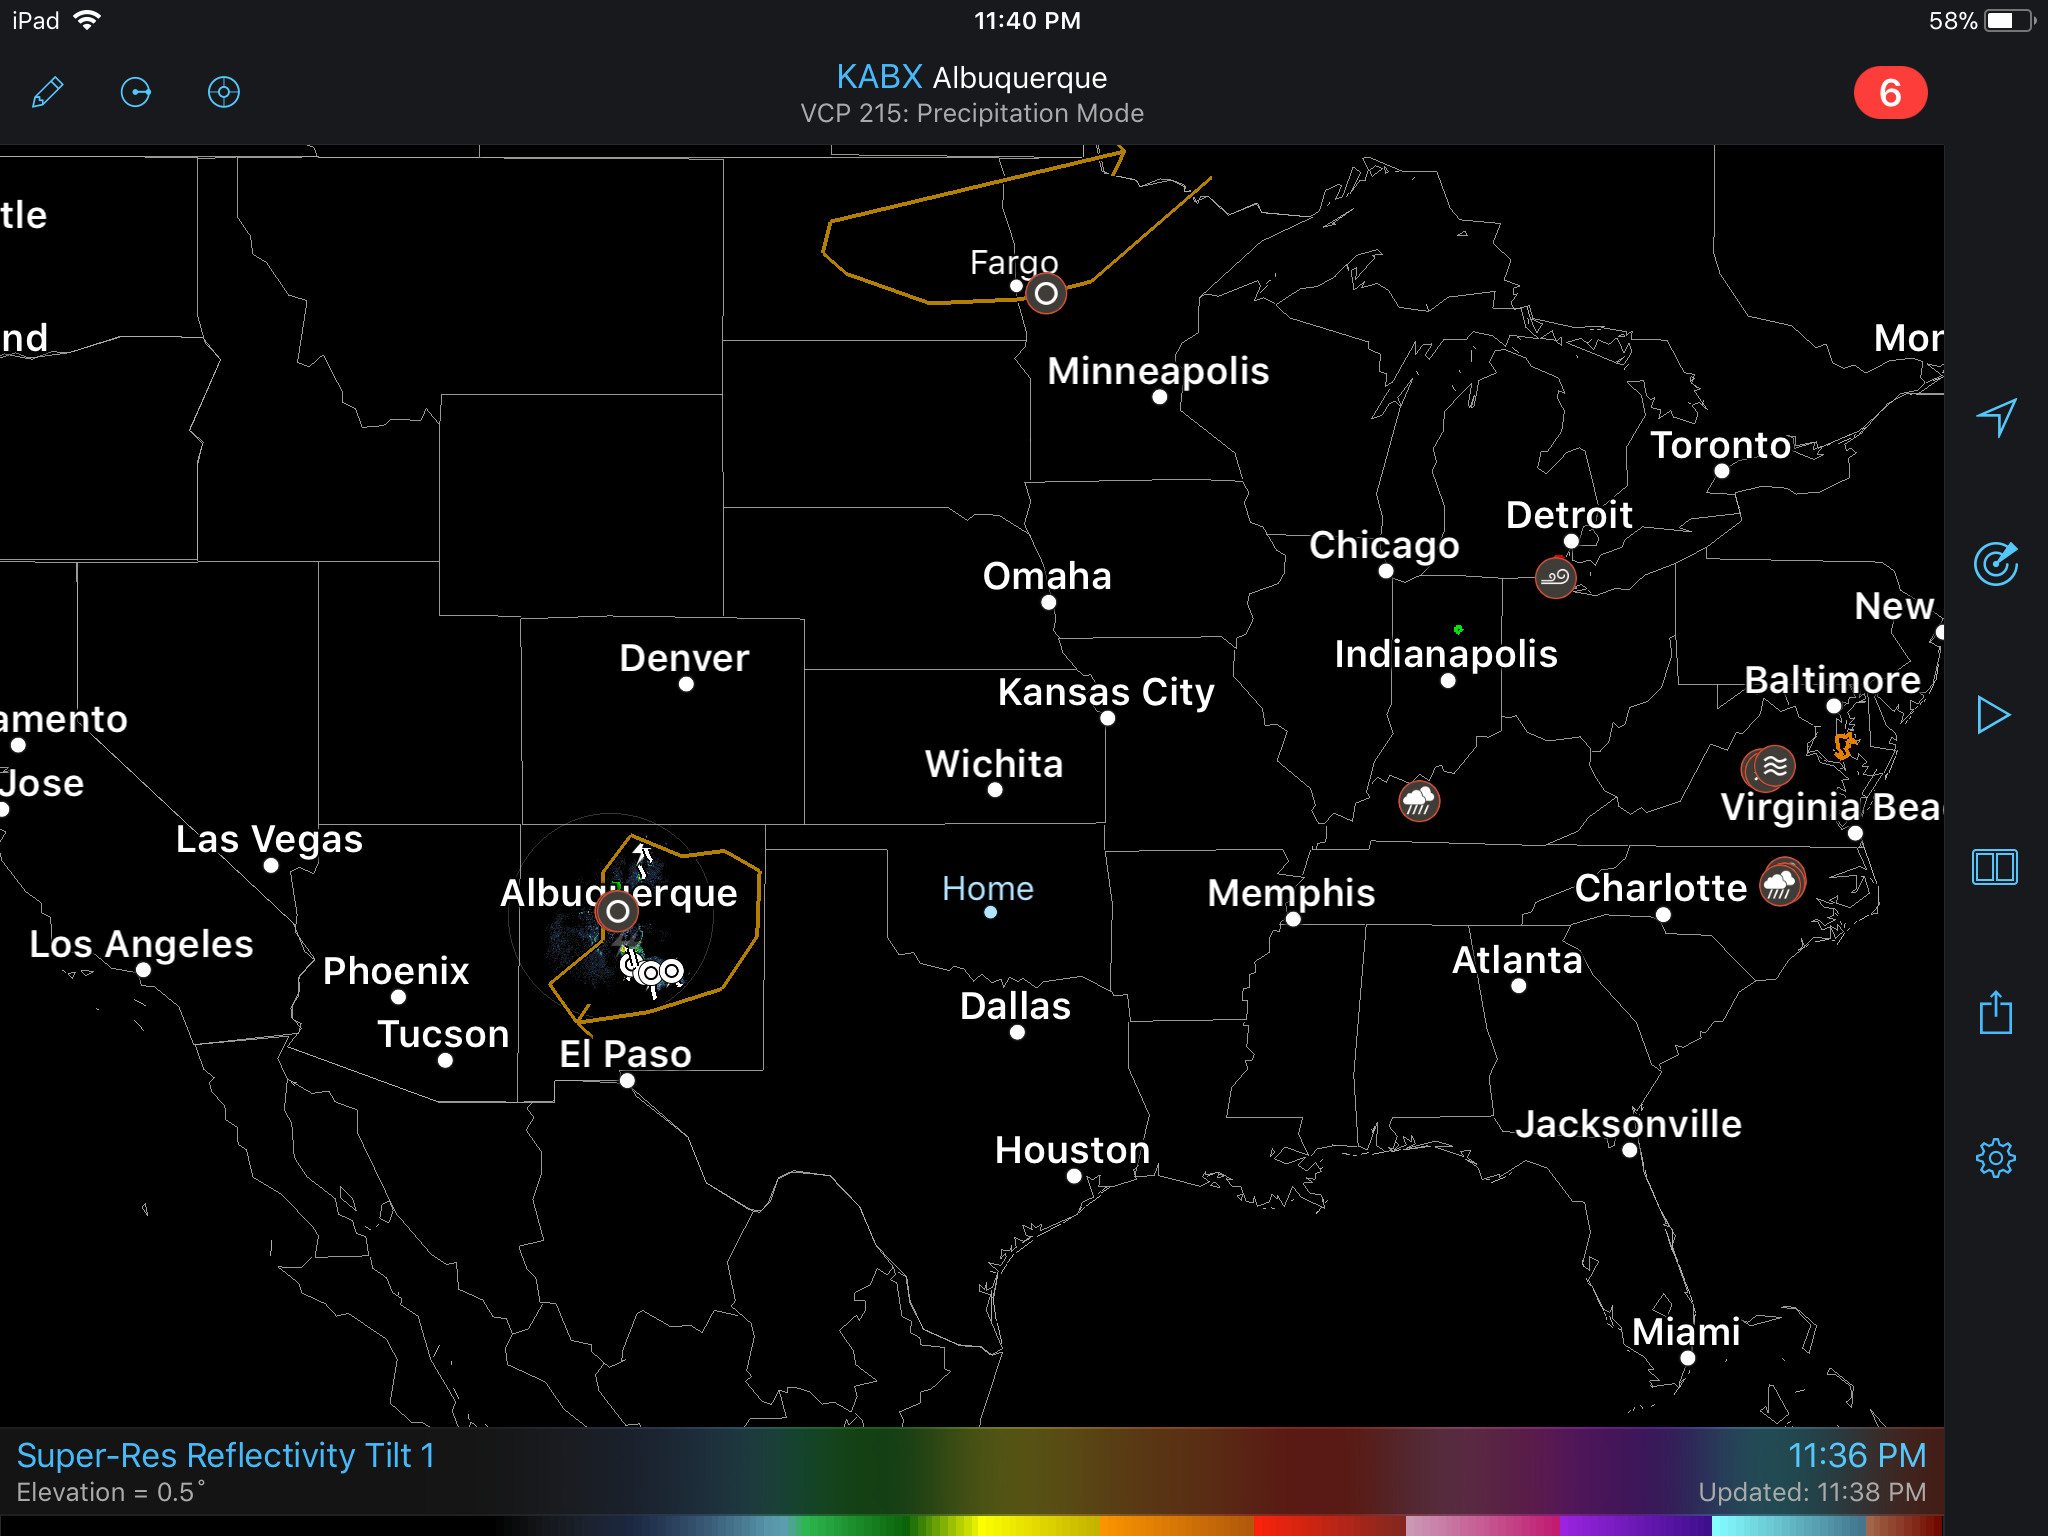
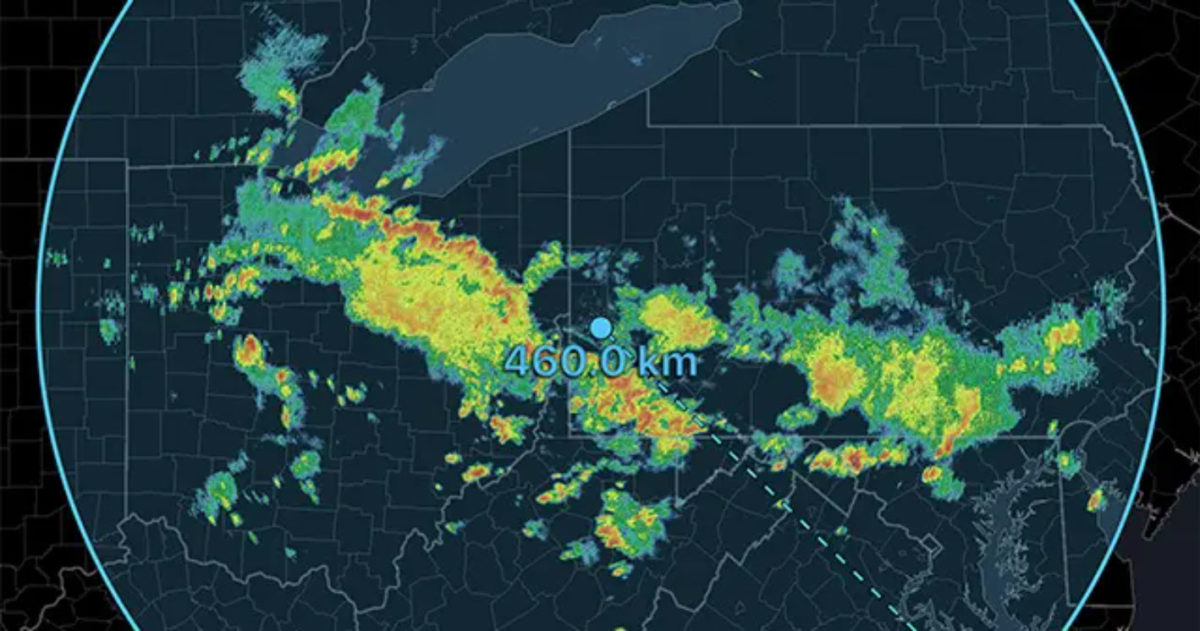
Day 1 Convective Outlook in RadarScope
Severe thunderstorms developed in eastern North Dakota on the evening of July 31, 2018. These storms produced large hail and damaging winds, as the warning text from the local National Weather Service office stated. In addition to viewing the radar data, warnings, and storm tracks in RadarScope, hail contours can be overlaid on the image with a RadarScope Pro Tier 2 subscription. These contours are derived by WDT algorithms that use several different variables to determine hail size including reflectivity, differential reflectivity, and correlation coefficient. The color of the contour indicates the estimated hail size. Contours are drawn for hail sizes between 0.75 and 4.00 inches in intervals of 0.25 inch. Need more information about what you’re seeing? No problem! The inspector tool can give you a data readout of the feature you’re viewing.
Storm tracks are indicated by white lines with tick marks in the direction that the storm is expected to move. Each tick mark denotes the forecast position of the storm in 15-minute intervals. Here is an image showing the hail contours, storm tracks, and the inspector tool.
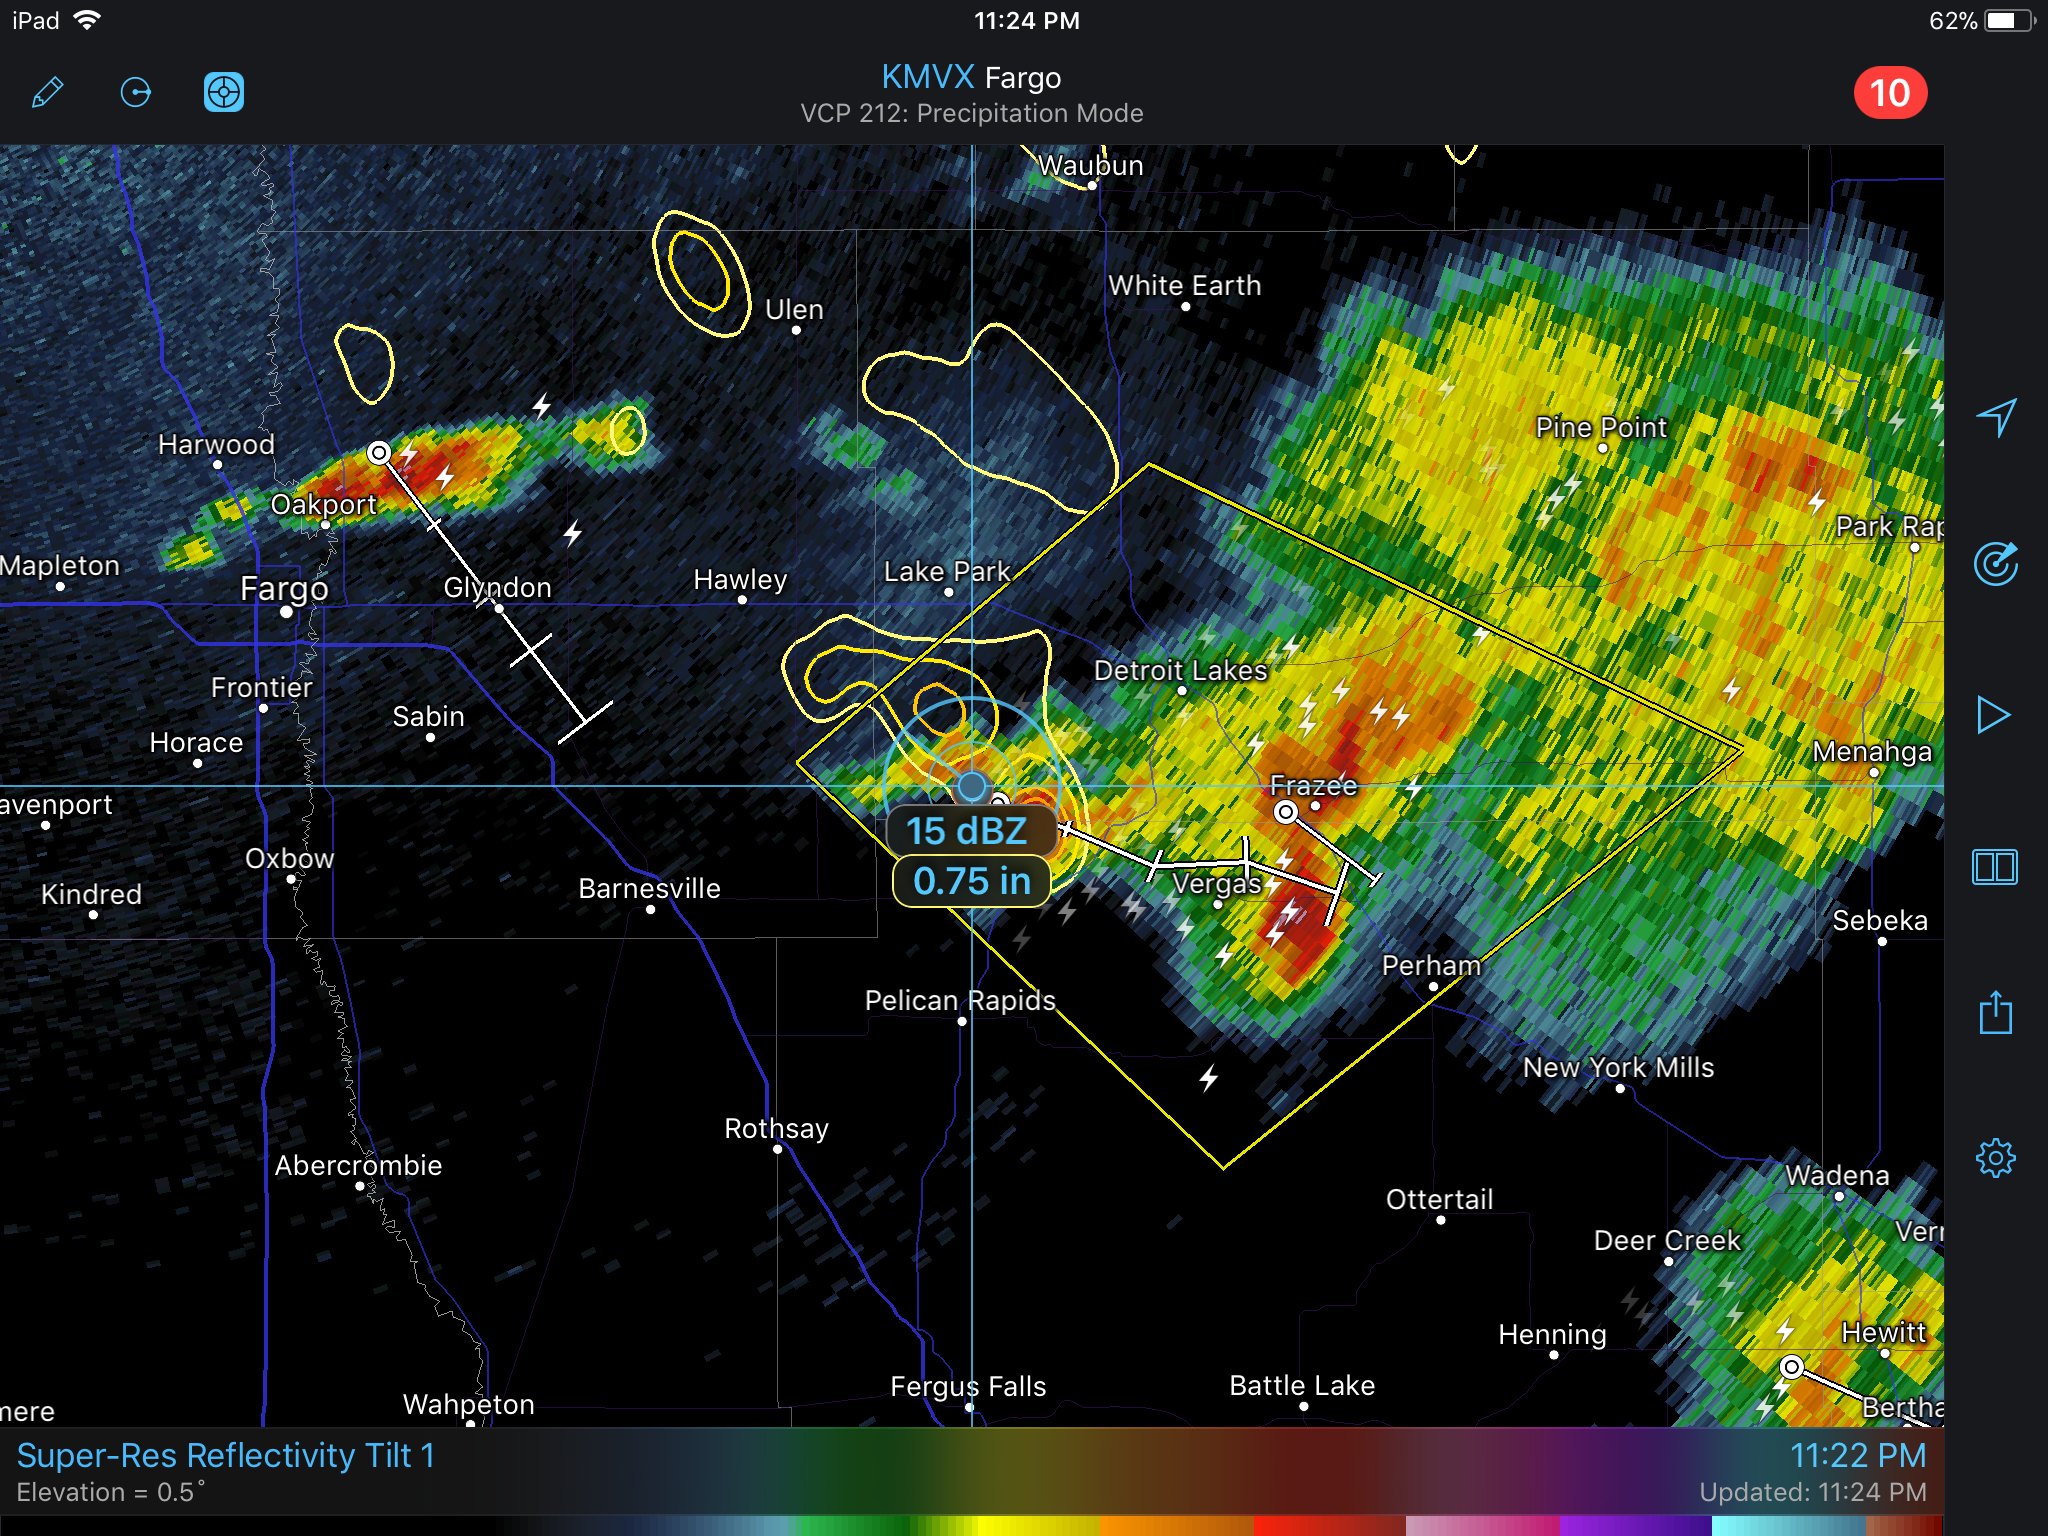
Storm Tracks and Hail Contours in RadarScope
In addition to these hail contours, Local Storm Reports can be overlaid. These reports are provided by the general public, storm spotters, and law enforcement, and are often used in issuing warnings. The storms, in this case, produced golf ball size (1.75 inches) hail according to a Local Storm Report. The text of the report can be seen by selecting the icon representing the report.
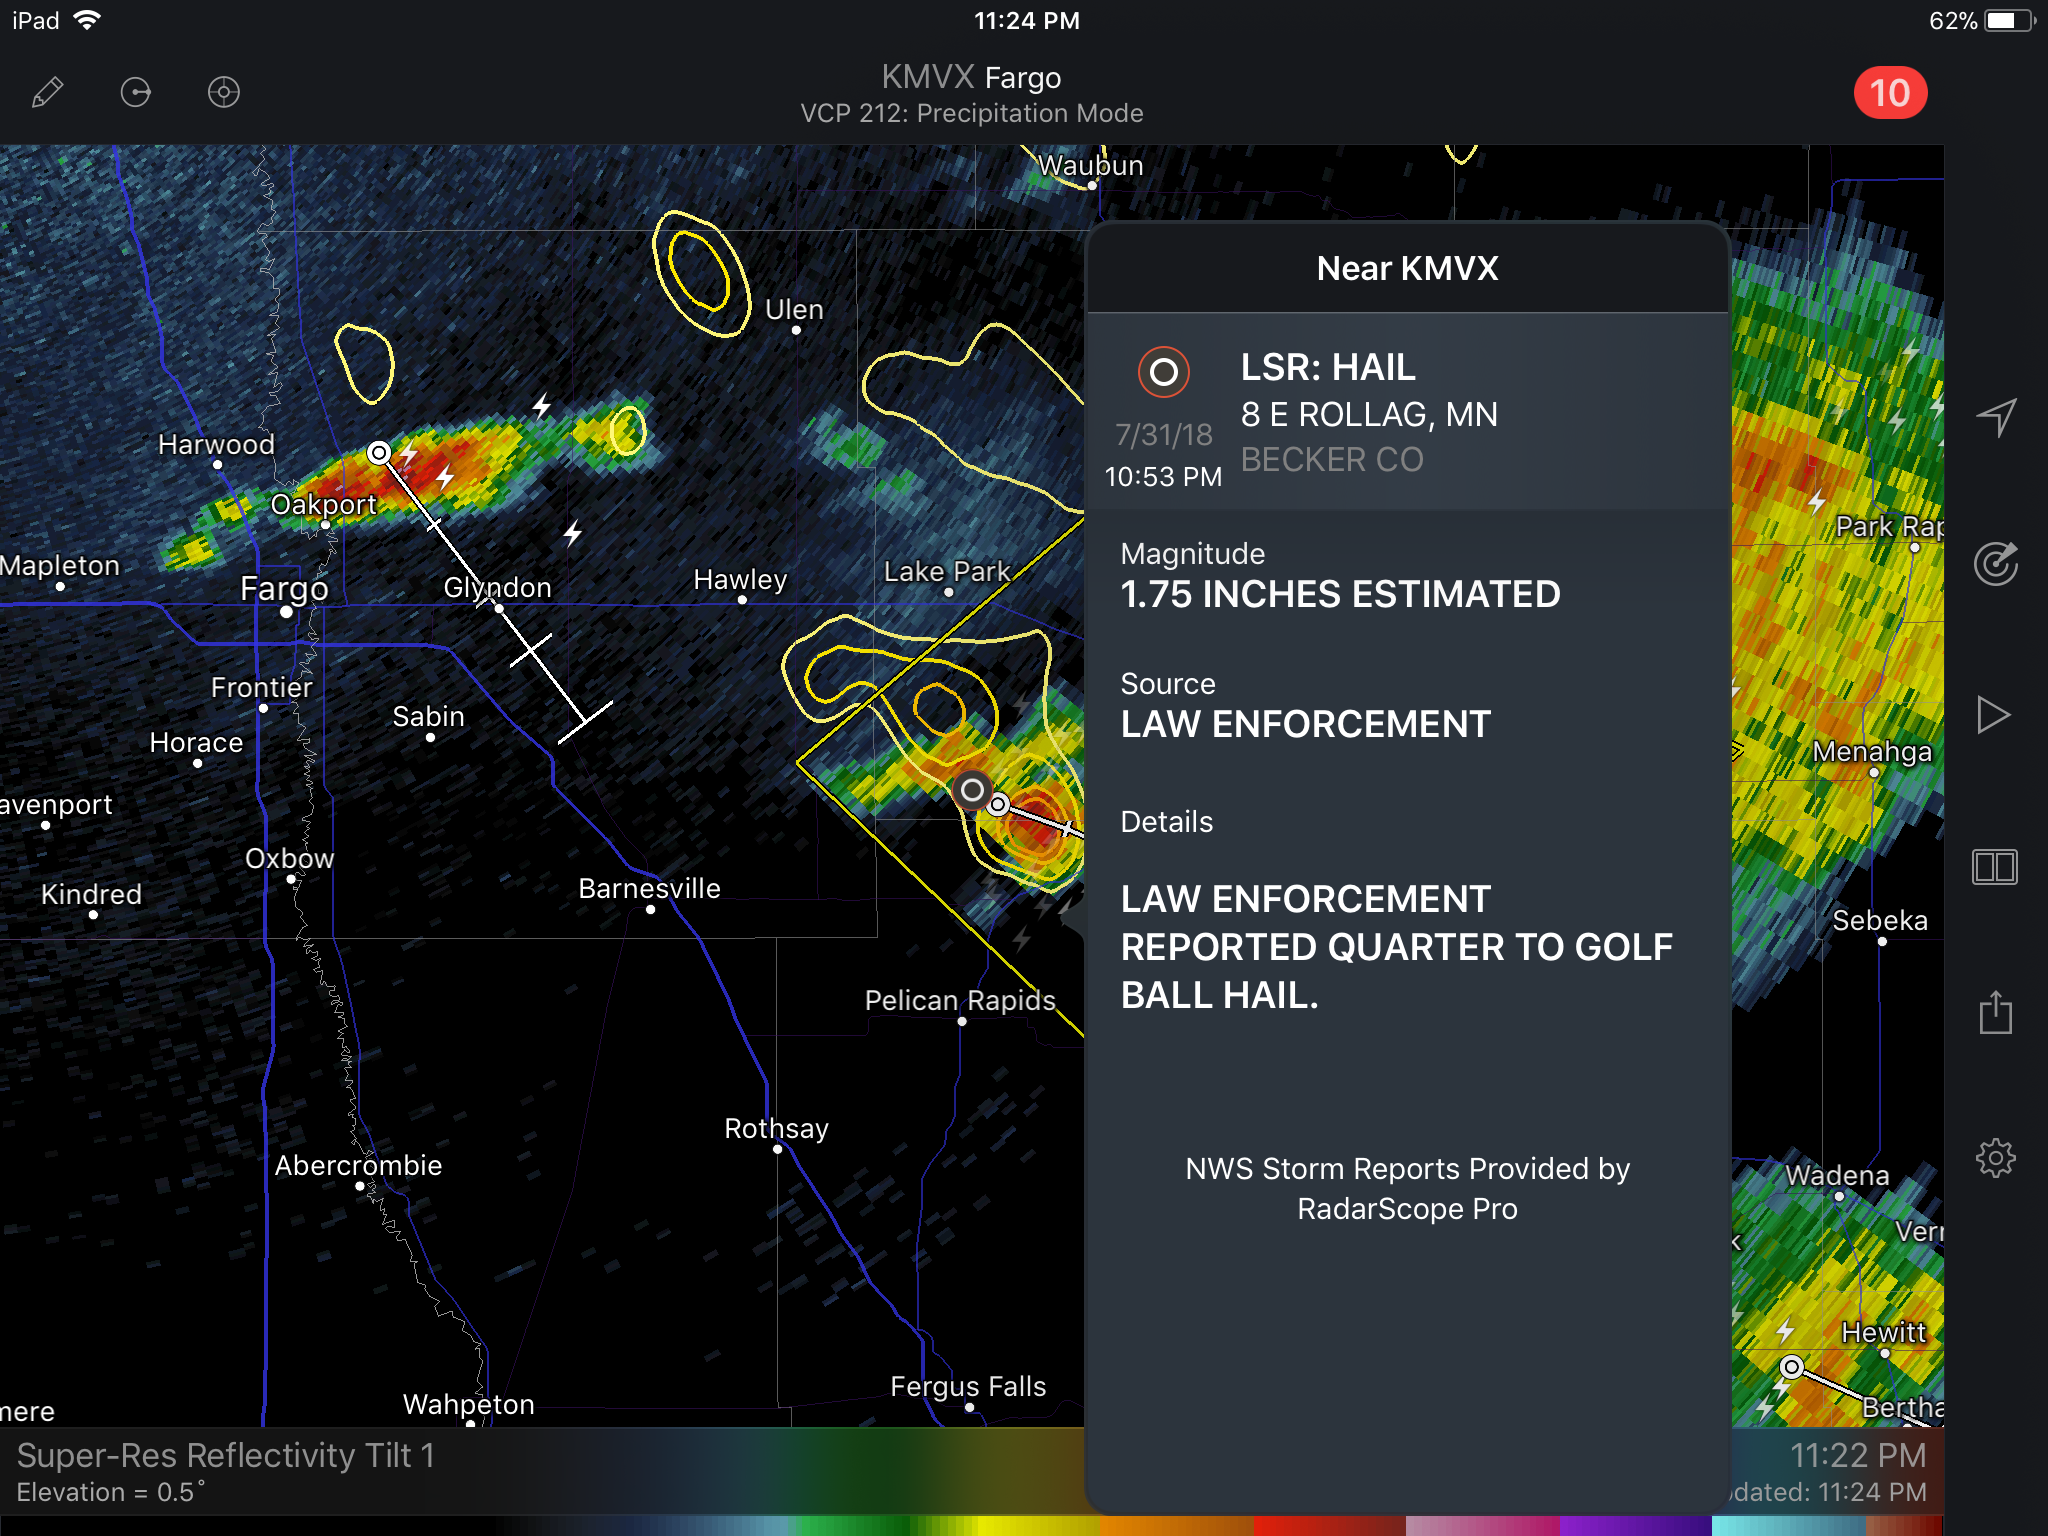
Local Storm Report in RadarScope
This report prompted the issuance of a Severe Thunderstorm Warning by the local National Weather Service office, which can be viewed by touching the warning polygon and tapping the “i” icon in the box describing the warning.
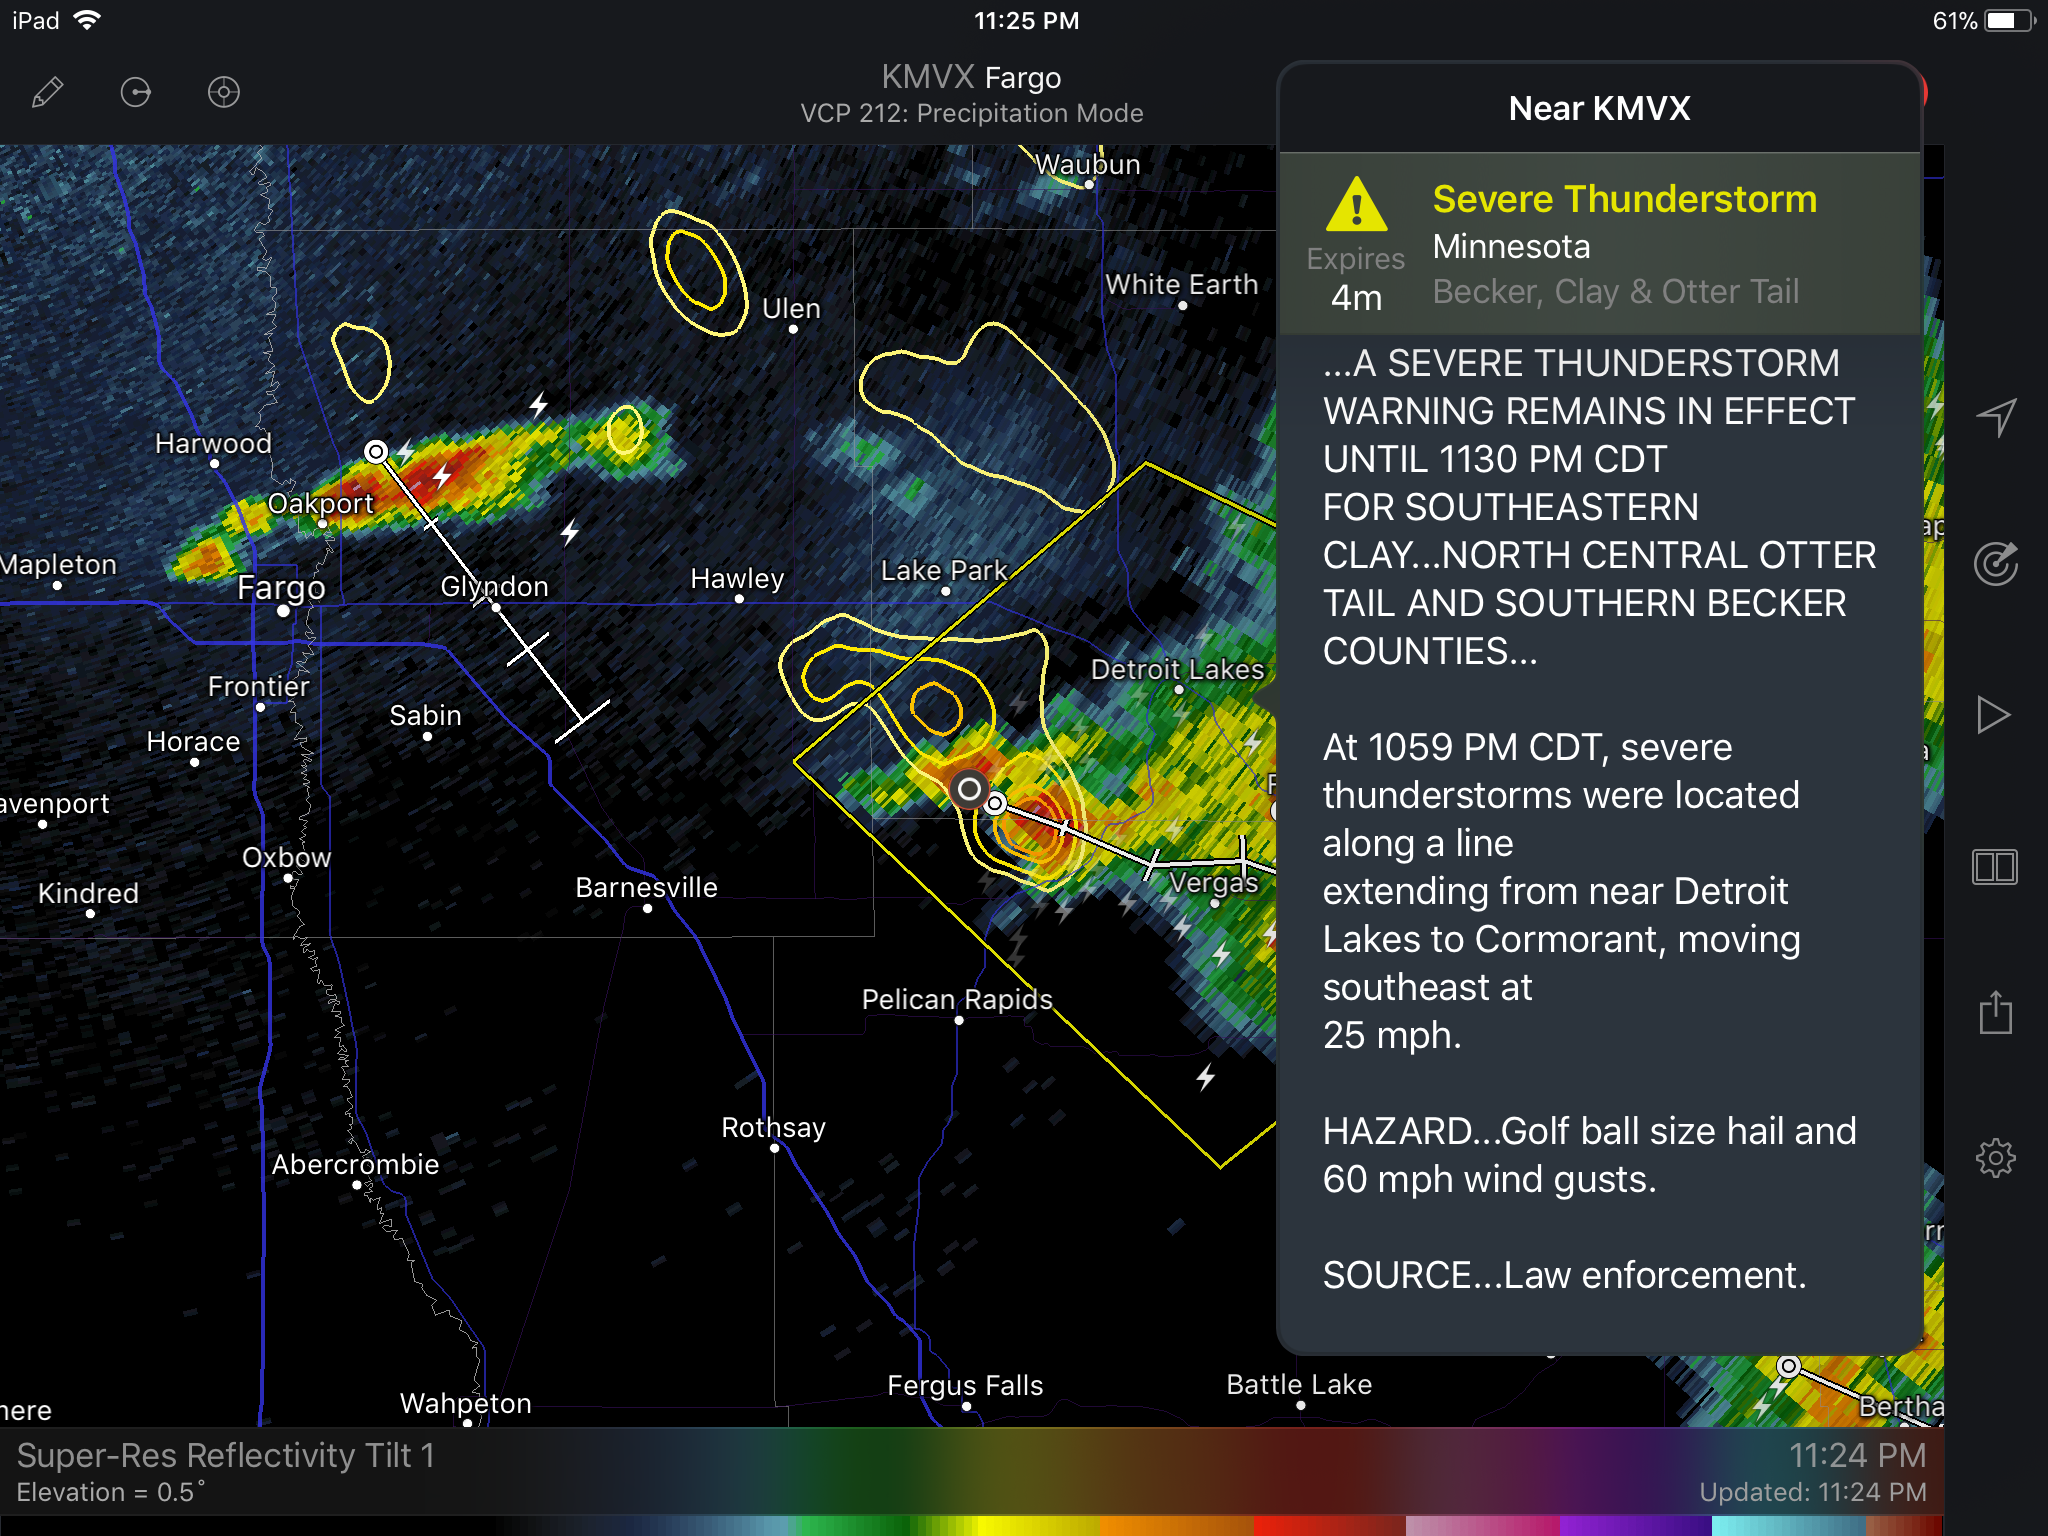
Warning Text in RadarScope
From the forecast of severe thunderstorms to the warning of an ongoing storm, each stage can be quickly accessed in RadarScope. This wealth of information at your fingertips can help you make more informed decisions when severe weather is expected or occurring.