Winter is in full swing and that means we’re experiencing a wide range of weather. Heavy rain, freezing rain, sleet and snow, we’ve got it all. Often, especially in the early stages of an event, more than one precipitation type is being produced. In winter, there can be a transition line from liquid precipitation to frozen precipitation.
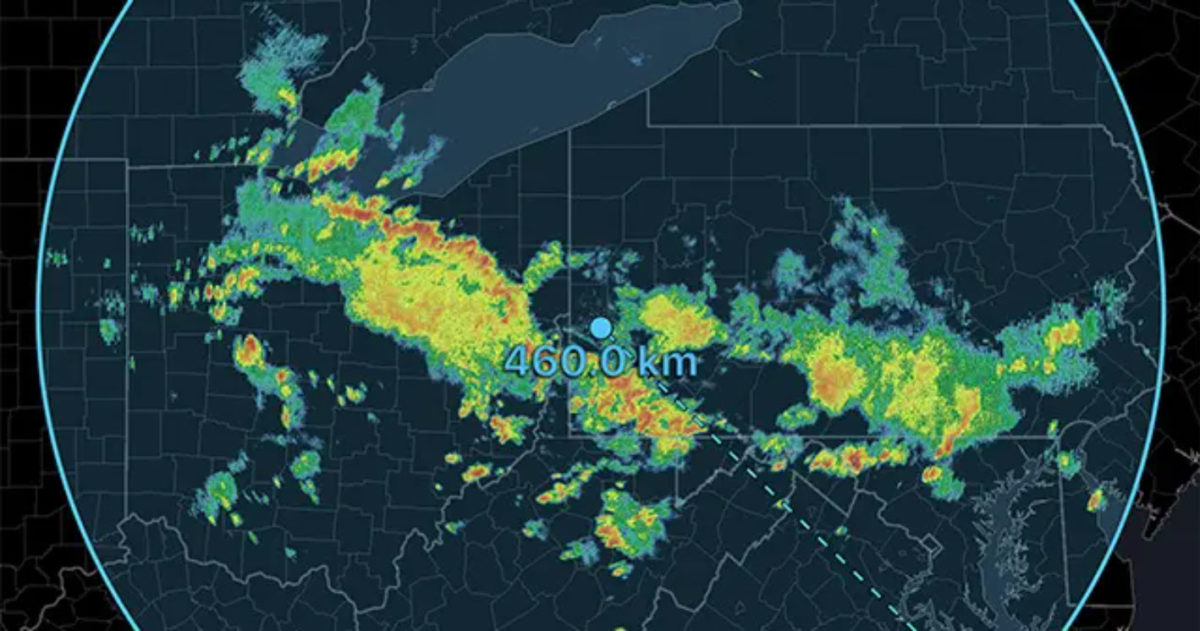
Different types of precipitation can have a variety of radar signatures. Distinguishing frozen from liquid precipitation has implications on infrastructure, travel, and property. For instance, consider this reflectivity image from KEAX, the NEXRAD radar near Kansas City, Missouri.

Over a relatively short distance, the precipitation changes from liquid to frozen, but it’s hard to tell where with reflectivity data. To identify where this transition occurs in this case, we can look at the dual polarization products Differential Reflectivity and Correlation Coefficient.
Differential Reflectivity
Differential Reflectivity is the ratio of the power reflected from the vertically polarized pulse to the horizontally polarized pulse. Hydrometeors that are wider than they are tall will have a positive value whereas hydrometeors that are taller than they are wide will have a negative value. When the hydrometeor is roughly spherical, the number will be close to 0. This is the Differential Reflectivity from the same event from above.

Generally, the higher values (green) are further east and the lower values (dark blues and purples) are further west. Where the Differential Reflectivity begins to decrease, the precipitation is likely beginning to freeze, but another product may help in further establishing the transition.
Correlation Coefficient
The next product is the Correlation Coefficient. This product is a measure of how similar the power returns from the horizontal and vertical pulses are. Values close to 1 indicate a homogeneous, or similar, precipitation type whereas lower values indicate mixed precipitation types. In the transition zone, correlation coefficient values will be around .95. This is the Correlation Coefficient product from RadarScope.

In this image, the red shades indicate fairly similar precipitation type whereas the orange shades indicate a decrease in Correlation Coefficient, and likely a mixture of precipitation types. The red shades, in the far west, possibly represent all frozen hydrometeors.
Knowing how to identify the melting layer from radar data can help you make more informed decisions regarding travel and other infrastructure concerns. The Precipitation Depiction option within the RadarScope mobile app also utilizes the above products to produce a product to easily identify precipitation type at a glance. This information can help you prevent or minimize risk to lives and property.
{{cta(‘7adc9887-5a2e-4a2c-90de-3d3a733f8912′,’justifycenter’)}}